


Key Takeaways
- India’s dominance in offshore engineering is strengthening as 1580 GCCs are already operating in India, generating $50 billion annually.
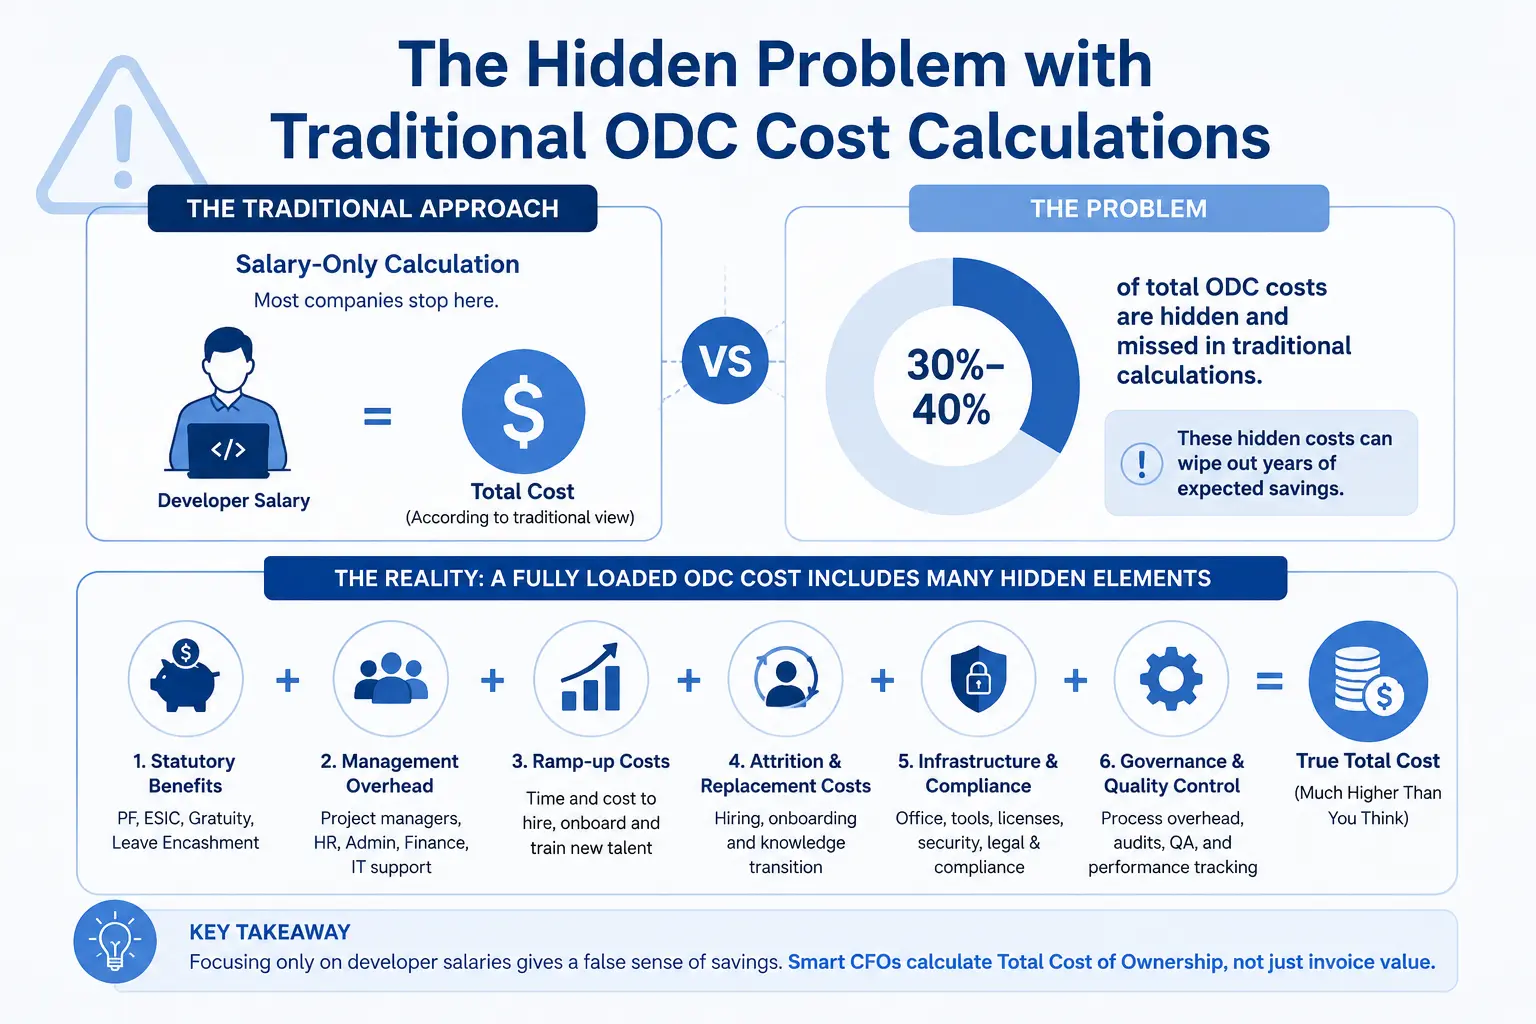
- Most companies underestimate India ODC costs by focusing only on salaries, missing 30% to 40% of hidden costs that wipe out years of savings.
- Start with an ODC partnership or a dedicated team for 1 to 2 years, validate the model, and then transfer it to BOT or captive for long-term cost optimisation.
- India’s ODC dominance is compounding each year, and it is the right time for CFOs to make data-driven decisions rather than salary-based guesses.
Introduction
India now hosts more than 2100 global capacity centres, a 32% increase since the financial year 2021. According to the Zinnov-Nasscom GCC Landscape Report, this growth indicates that offshore engineering has moved from cost experimentation to a core operating strategy for global companies.
The idea behind these expansions is simple: hire engineering talent in India at a fraction of US or European rates, with the assumption that the savings would compound from there. But the monthly invoice rarely gives you the complete picture.
Most CFOs price an India ODC the way they would price a vendor contract and omit the costs that arise after the contract is signed. The total cost of ownership increases by 25% to 150% above the base rate when hidden operational factors, such as management overhead and the productivity gap between a fully functional team and a new one.
This is where ODC costs in India need a different lens, as it is a multi-year capital decision. In this article, we explain why finance leaders are reevaluating offshore engineering economics and have started looking beyond developer salaries.
Executive Summary: What does an India ODC Really Cost?
If you assume the cost of ODC in India is equal to the invoices generated by your technical partner, there is a big gap that you are missing. What is more concerning is that the gap can have a big impact on your investment and financial planning.
Why Most ODC Cost Calculations Are Incomplete?
Most ODC cost calculations stop at the invoice: salary multiplied by headcount. But finance leaders have to understand that it’s a fraction of the actual spend, even though the numbers are true.
Looking Beyond Developer Salaries
A fully loaded ODC cost includes:
- Provident Fund
- ESIC and gratuity
- Management overhead
- Ramp-up time for new hires and
- The cost of engineers who leave during a project
A study by McKinsey found that 66% of enterprise software projects exceed their budget. They also found that the longer the project runs, the more likely it is to overrun the budget.
The CFO’s Perspective on Offshore Investments
Finance leaders are no longer comparing the salaries of engineers in the US and India. They are looking at a multi-year picture instead of considering short-term savings alone. For example, they started asking what the total cost is for 3 years and the output during that time, not just how much we’re saving per engineer.
Why CFOs are Re-evaluating Offshore Engineering Economics
CFOs are recalculating whether offshore engineering is as financially attractive as it sounds because the recalibration is not random and is being pushed by the following factors.
Rising Engineering Costs in North America and Europe
The math that made offshoring a better option didn’t go anywhere, but it just intensified. The salary for a mid-career US software engineer is now $155,000, which was $148,000 in 2024. People who are skilled in AI and cloud demand a premium on top of that.
The Shift from Cost Arbitrage to Capability Building
Companies no longer build India ODCs just to save money on salaries. Almost all GCC leaders say their India centres do much more than cut costs. They build real capabilities and drive innovation. That’s why CFOs have stopped asking “How cheap is this?” and now ask “What capability does this build for us over time?”
Measuring Offshore ROI Beyond Headcount Savings
CFOs are no longer judging an Indian ODC just by how much cheaper engineers are or how many people they can replace. They’re now measuring it like any major investment.
The CFOs are now asking, “How much faster are we launching products?” and “How much revenue or strategic value does the work create?”
The Hidden Problem with Traditional ODC Cost Calculations
The Salary-Only Fallacy
A mid-level engineer with 3 to 5 years of experience earns about $12,000 to $24,000 a year in India’s IT sector. At the same time, a US engineer with the same experience has a base salary of $155,000 per year.
Yes, the salary difference between India and the US is real. But it’s wrong to assume that salary alone is the total cost of an engineer.
That comparison only looks at one line item and ignores all the other expenses, such as software licenses and payroll taxes, that CFOs must account for when evaluating an ODC in India.
Ignoring Operational and Governance Costs
What that comparison skips is everything required to run the team, such as compliance and data-security costs and legal entity setup, that a CFO has never met. All of this appears on the budget but not on the salary line.
Underestimating Attrition and Talent Replacement Costs
In Indian GCCs, the attrition rate is now around 12.6%, which is a historic low. But that doesn’t mean your total bill automatically goes down, as just fewer people are leaving.
Replacing an employee in India can cost anywhere from 40% of the annual salary for frontline roles. For example, if a person who earns 12 lakhs per year leaves the company, the replacement cost is 4.8 lakhs. This value is much higher for managerial or specialised roles.
Even at 12.6% attrition, if you have 20 engineers, you’ll lose about 2 to 3 people per year. Most ODC budgets don’t even plan for one person leaving, so they’re missing a huge hidden cost that can quickly add up.
Complete Cost Breakdown of an Indian ODC
Cost Components by Category
Once every cost category is taken into account, the picture looks less like a salary line and more like an operating budget. Here’s how the costs are split:
| Cost Component | Annual Cost Impact | % of Total ODC Cost |
|---|---|---|
| Salaries & Benefits | $250,000 – $350,000 | 55-60% |
| Attraction and Onboarding | $15,000 – $25,000 | 4 to 6% |
| Management Overhead | $30,000 – $50,000 | 8 to 12% |
| Office Infrastructure | $20,000 – $30,000 | 5 – 7% |
| Tools and Technology | $15,000 – $25,000 | 4 to 6% |
| Cloud and Infrastructure | $10,000 – $20,000 | 3 – 5% |
| Security and Data Protection | $5,000 – $10,000 | 2 – 3% |
| Attrition and Replacement Costs | $20,000 – $40,000 | 5 – 8% |
| Total (1 Year Fully Loaded) | $450,000 – $650,000 | 100% |
One-Time Setup Costs vs Recurring Costs
For a mid-market 10-person ODC, one-time setup costs $100,000 to $650,000, depending on scale and city. The annual operational costs for the same team run $355,000 to $525,000 per year.
Even though the setup number gets evaluated once, the recurring costs compound every year the centre operates. Most CFOs obsess over the one-time setup cost, completely ignoring the recurring costs, which compound every 3 to 5 years.
ODC Cost Estimation by Team Size
The cost of an Offshore Development Centre in India doesn’t scale linearly. As team size grows, you get economies of scale on infrastructure and management. But you also face added complexity in governance and attrition management.
| Team Size | Fully Loaded Annual Cost | Cost Per Engineer (Annual) | Setup Cost for 1 year |
|---|---|---|---|
| 10 Person | $355,000 to $525,000 | $35,500 to $52,500 | $100,000 – $650,000 |
| 20 Person | $700,000 to $1.1 million | $28,000 to $44,000 | $200,000 – $1.2 million |
| 50 Person | $1.2 Million – $2.1 Million | $24,000 to $42,000 | $400,000 – $2.0 million |
| 100 Person | $2.2 Million to $4.0 Million | $22,000 – $40,000 | $800,000 – $3.0 million |
Cost of a 10-Person Offshore Engineering Team
Profile: Mid-market startup or product company setting up its first offshore hub.
| Cost Type | Annual Range |
|---|---|
| Salaries & Benefits | $250,000 – $350,000 |
| Attraction and Onboarding | $30,000 – $50,000 |
| Management Overhead | $20,000 – $30,000 |
| Office Infrastructure | $15,000 – $25,000 |
| Tools and Technology | $10,000 – $20,000 |
| Cloud and Infrastructure | $5,000 – $10,000 |
| Security and Data Protection | $5,000 – $10,000 |
| Attrition and Replacement Costs | $20,000 – $40,000 |
| Total (1 Year Fully Loaded) | $355,000 – $525,000 |
| Setup Cost for 1 Year | $100,000 – $650,000 |
| Year 1 Fully Loaded Total | $455,000 – $1.175 Million |
Cost of a 25-Person Offshore Engineering Team
Profile: Scaling product company or mid-market enterprise
| Cost Type | Annual Range |
|---|---|
| Salaries & Benefits | $550,000 – $750,000 |
| Attraction and Onboarding | $50,000 – $80,000 |
| Management Overhead | $35,000 – $50,000 |
| Office Infrastructure | $25,000 – $40,000 |
| Tools and Technology | $20,000 – $35,000 |
| Cloud and Infrastructure | $8,000 – $15,000 |
| Security and Data Protection | $8,000 – $15,000 |
| Attrition and Replacement Costs | $40,000 – $70,000 |
| Total (1 Year Fully Loaded) | $700,000 – $1.1 Million |
| Setup Cost for 1 Year | $200,000 – $1.2 Million |
| Year 1 Fully Loaded Total | $900,000 – $2.3 Million |
Cost of a 50-Person Offshore Engineering Team
Profile: Enterprise with mature GCC
| Cost Type | Annual Range |
|---|---|
| Salaries & Benefits | $1.0M – $1.5M |
| Attraction and Onboarding | $80,000 – $120,000 |
| Management Overhead | $55,000 – $80,000 |
| Office Infrastructure | $40,000 – $65,000 |
| Tools and Technology | $35,000 – $55,000 |
| Cloud and Infrastructure | $12,000 – $25,000 |
| Security and Data Protection | $12,000 – $25,000 |
| Attrition and Replacement Costs | $70,000 – $120,000 |
| Total (1 Year Fully Loaded) | $1.2 Million – $2.1 Million |
| Setup Cost for 1 Year | $400,000 – $2.0 Million |
| Year 1 Fully Loaded Total | $1.6 Million – $4.1 Million |
Cost of a 100-Person Offshore Engineering Team
Profile: Large enterprise GCC
| Cost Type | Annual Range |
|---|---|
| Salaries & Benefits | $2.0 M – $3.0 M |
| Attraction and Onboarding | $120,000 – $200,000 |
| Management Overhead | $90,000 – $130,000 |
| Office Infrastructure | $65,000 – $100,000 |
| Tools and Technology | $55,000 – $90,000 |
| Cloud and Infrastructure | $20,000 – $40,000 |
| Security and Data Protection | $20,000 – $40,000 |
| Attrition and Replacement Costs | $120,000 – $200,000 |
| Total (1 Year Fully Loaded) | $2.2M to $4.0M |
| Setup Cost for 1 Year | $800,000 – $3.0M |
| Year 1 Fully Loaded Total | $3.0M – $7.0M |
India ODC vs In-House US Engineering Team Cost Comparison
Instead of deciding on headline salary differences, CFOs are now comparing fully loaded cost per unit of output over multiple years. Here is a comparison of an India ODC vs. an in-house US engineering team.
Annual Cost Comparison
In this table, we are comparing the fully loaded annual cost of a 25-person engineering team in India in Tier-1 cities such as Bangalore or Chennai vs. the US mid-cost market.
| Cost Type | India ODC (25-person) | US In-House (25-person) |
|---|---|---|
| Salaries & Benefits | $550,000 – $750,000 | $2.75M – $3.75M |
| Attraction and Onboarding | $50,000 – $80,000 | $125,000 – $200,000 |
| Management Overhead | $35,000 – $50,000 | $100,000 – $150,000 |
| Office Infrastructure | $25,000 – $40,000 | $50,000 – $80,000 |
| Tools and Technology | $20,000 – $35,000 | $40,000 – $70,000 |
| Cloud and Infrastructure | $8,000 – $15,000 | $20,000 – $35,000 |
| Security and Data Protection | $8,000 – $15,000 | $20,000 – $35,000 |
| Attrition and Replacement Costs | $40,000 – $70,000 | $60,000 – $100,000 |
| Total (1 Year Fully Loaded) | $700,000 – $1.1 Million | $3.17M – $4.42M |
Five-Year Cost Analysis
You have to model costs over 3 to 5 years as recurring costs compound every year, while setup costs are one-time.
| Year | India ODC | US In-House (Cumulative) |
|---|---|---|
| Year 1 (Setup + Recurring) | $900K – $2.3M | $3.17M – $4.42M |
| Year 2 | $1.6M – $3.4M | $6.34M – $8.84M |
| Year 3 | $2.3M – $4.5M | $9.51M – $13.26M |
| Year 4 | $3.0M – $5.6M | $12.68M – $17.68M |
| Year 5 | $3.7M – $6.7M | $15.85M – $22.1M |
Cost Per Engineer Comparison
This table shows how economies of scale reduce the cost per engineer as team size grows.
| Team Size | India ODC (Cost Per Engineer/Year) | US In-House (Cost Per Engineer/Year) | India vs US Savings (approximately) |
|---|---|---|---|
| 10-person | $35,500 – $52,500 | $317,000 – $442,000 | 65% – 75% |
| 25-person | $28,000 – $44,000 | $317,000 – $442,000 | 70% – 75% |
| 50-person | $24,000 – $42,000 | $317,000 – $442,000 | 70% – 75% |
| 100-person | $22,000 – $40,000 | $317,000 – $442,000 | 70% – 75% |
India vs US Engineering Cost Model (25-Person Team)
| Metric | India ODC | US In-House | India vs the US |
|---|---|---|---|
| Fully Loaded Annual Cost | $700K – $1.1M | $3.17M – $4.42M | 65% to 75% savings |
| 5-Year Cumulative Cost | $3.7M – $6.7M | $15.85M – $22.1M | 70% to 75% savings |
| Cost Per Engineer | $28K – $44K | $317K – $442K | 70% to 75% savings |
| Setup Cost (Year 1) | $200K – $1.2M | $0 (no setup) | One-time India cost |
| Recurring Cost (Year 2+) | $700K – $1.1M/Year | $3.17M – $4.42M/Year | Dominates long-term |
| Management Overhead % | 8 to 12% of the total | 4 to 6% of the total | Higher India % |
| Attrition Rate | 12.6% (India tech) | 8 to 10% (US tech) | India is higher, but the replacement cost is lower |
| Replacement Cost | 40-200% of Salary | 100 – 250% of Salary | India’s lower % but still significant |
The Hidden Costs That Most Businesses Miss
Employee Attrition
Attrition hits different roles in different ways. Losing a junior developer is not the same as losing a tech lead or architect who is three years into a project. Most TCO models use an average replacement cost and miss that the real exposure of a project is in the hands of a few irreplaceable people.
Knowledge Transfer Losses
When such an irreplaceable person leaves, the lack of knowledge and expertise rarely shows on any invoice. It hides behind undocumented architecture decisions and client context. Rebuilding that pace isn’t a line item and leads to slower delivery.
Productivity Ramp-Up Periods
New developers need three to six months to reach full productivity, and people filling senior or highly technical roles take almost a year to settle. A CFO who budgets a new hire at full output from day one is overstating the team’s capacity for half a year.
Communication and Time Zone Management
India is nearly 10 hours ahead of US Eastern time, leaving no natural overlap in a standard workday. Every decision that needs same-day input either waits till next day or costs someone an odd-hours call. Both these options have a real productivity price.
Compliance and Security Investments
India’s Digital Personal Data Protection Act adds compliance obligations on top of standard labour law. Industry estimates suggest that HR, legal, and compliance functions together run 3% to 6% of total operating cost for mid-sized ODCs. This cost goes higher for regulated sectors like Fintech, which is 6% to 10%, and lower for non-financial sectors. Most financial leaders entirely skip this category in salary-based ODC cost estimates.
ODC Setup Models and Their Financial Impact
Let us discuss the different models to set up an Offshore Development Centre in India and how each model affects your costs and outcome.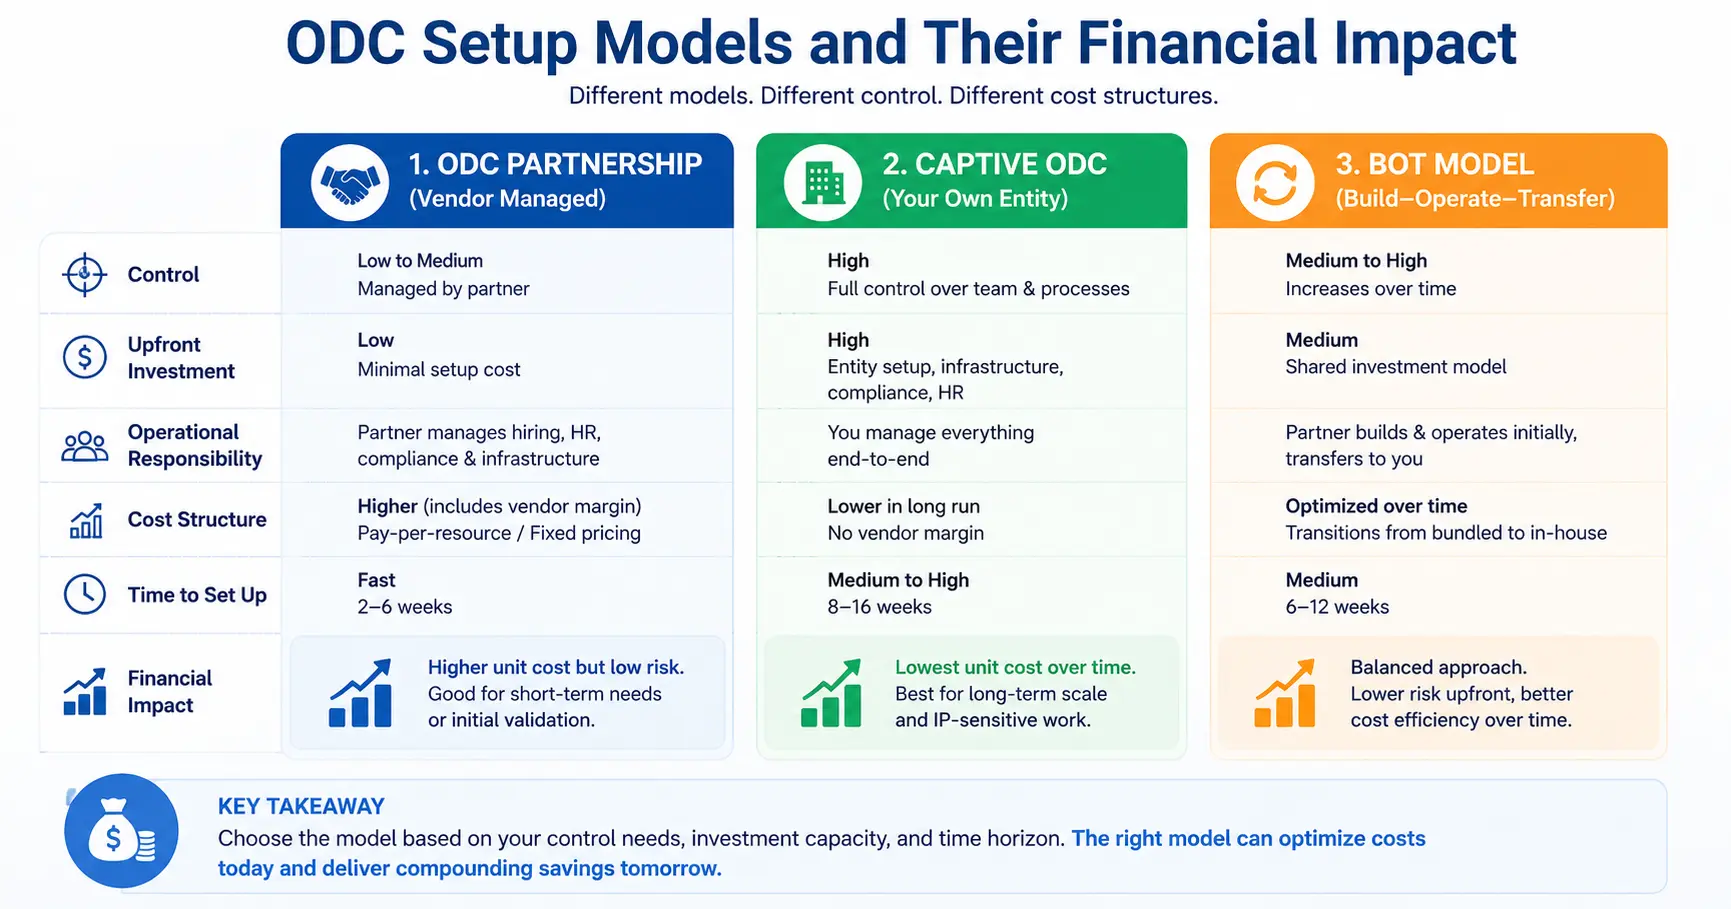
| Engagement Model | Setup Cost | Cost Structure | Time to Operational |
|---|---|---|---|
| Captive Centre | $500K – $3M | Salary and full overhead. | 12 to 18 months |
| ODC Partnership | Is minimal | Salary and 15 to 35% vendor margin | 6 to 12 weeks |
| Build-Operate-Transfer | Funded by the vendor in the initial stages | Vendor margin during build shifts to in-house cost at transfer | 12 to 24 months to transfer |
| Dedicated Development Team | Setup costs are minimal and usually the lowest | 20% to 40% markup along with salary | 2 to 4 weeks |
Offshore Development Centre Partnership
Offshore development companies in India builds and manages the team on your behalf, which means you do not need entity setup. But vendor margins add 15% to 35% on top of employee salaries every year. In this model, you have an operational team within 6 to 12 weeks.
Build-Operate-Transfer (BOT) Model
In the BOT model, a vendor builds and runs your India ODC for 1 to 2 years and then hands over everything to you. You get speed upfront and control later without paying the full setup cost from the beginning.
Dedicated Development Team Model
This is the lowest commitment model, where you direct a vendor-supplied team with no entity and no long-term lock-in. Markups for this style of staffing arrangement are commonly cited in the same 20% to 40% range as EOR engagements. Similar to ODC partnerships, that markup runs from the life of the contract, not just as setup.
India ODC ROI Analysis: Beyond Cost Savings
Faster Product Development
A dedicated and embedded team ships faster than a project-based vendor relationship, as the team carries context across sprints without having to relearn for each engagement.
Access to Specialized Talent
India’s talent pool covers niche skills such as AI, cloud, and embedded systems. This talent supply may not exist in the company’s marketplace at any price.
Reduced Hiring Risk
A mis-hire in a tight US market can sit empty for months, leading to productivity loss. An ODC’s larger talent pipeline shortens that gap and spreads the risk across a bigger bench.
Improved Scalability
Scaling a US team by 20 engineers takes months of recruiting. Scaling an established ODC takes a few weeks because the sourcing infrastructure already exists.
Accelerated Time-to-Market
As the Indian team runs a few hours ahead of the home office, the offshore team can hand off a feature at the end of the day and receive the review by morning.
How AI is Changing Offshore Engineering Economics
AI tools are rewriting how the cost-benefit math is calculated for offshore engineering. Let us see how it impacts ODC in India.
AI-Assisted Development Productivity
Vendors claim AI coding gains of 50% to 100%. A controlled trial found that experienced developers were actually 19% slower with AI tools when everyone believed that they would speed up by 20%.
Impact on Team Size and Cost Structures
If AI genuinely reduces routine coding work, there will be a shift in the math as fewer junior hires are needed. The accountability will be more on senior engineers who can review and direct AI output, changing the cost mix instead of reducing headcount.
AI-Native Offshore Engineering Teams
The ODCs gaining ground aren’t just adding AI tools to old workflows. They’re restructuring how work is reviewed and assigned around AI output from the start. Not every ODC with a tool subscription can crack this.
Key Risks That Impact ODC’s Financial Performance
Let us discuss the risks that affect the financial performance of ODC in India and their outcomes.
Attrition Risk
We have already seen how the attrition rate has an impact on the replacement cost, and it can blow a carefully prepared budget mid-year.
Talent Availability Risk
Demand for AI and cloud specialists is outpacing supply even in India’s deep talent market. That’s why the hiring costs and timelines are increasing day by day.
Compliance Risk
Labour law and data protection change independently of your business decisions. Penalties because of non-compliance can erase years of savings in one finding.
Vendor Dependency Risk
In partnership or dedicated-team models, the vendor controls the relationship with the engineers. Losing that vendor relationship results in losing the team you’ve built carefully, and not just the contract.
Business Continuity Risk
Putting your entire ODC in one city is like betting everything on a single location. If that city has a problem, your entire operation stops. Most CFOs don’t do this for supply chains, but they accidentally do it for engineering, and that’s an enormous risk.
CFO Checklist: Evaluating an India ODC Investment
Before investing in an India Offshore Development Centre, CFOs need a framework to assess the ROI and long-term strategic fit. This checklist ensures you’re making a data-driven investment decision.
Financial Assessment Questions
CFOs need to calculate the full 5-year cost of an India ODC and not just salaries for 1 year. The goal is to spend 40% to 60% of what a US team costs. Before investing, you should have answers to questions such as:
- What’s the 5-year total cost of ownership?
- Is TCO 40% to 60% of US cost?
- What is the cost for one-time setup, and what are the recurring annual costs?
Operational Readiness Checklist
Operational readiness determines whether your ODC can deliver consistently without any disruption. You have to ensure that there’s a local talent pool of at least 500 qualified engineers within 20 kms and that the average hiring time is 30 to 45 days for senior and mid-level roles.
Governance and Compliance Review
Compliance failures erase years of ODC savings in a single penalty. So you have to ensure that you are complying with laws and regulations. If you’re going for an ODC partnership, look for vendors with security certifications.
Long-Term Scalability Considerations
The success of an ODC depends on planning for growth from day one. Your talent pipeline has to support scaling from 25 to 100 engineers without quality degradation. Infrastructure has to be expandable with office space that can double, and cloud costs scaling below $100 per engineer every month. Avoid a single city concentration risk by planning a phase 2 expansion to cities like Bangalore and Hyderabad if you start in Chennai.
How to Reduce ODC Costs Without Sacrificing Quality
Cost reduction isn’t about cutting salaries, and it is more about optimising location and team structure to increase efficiency.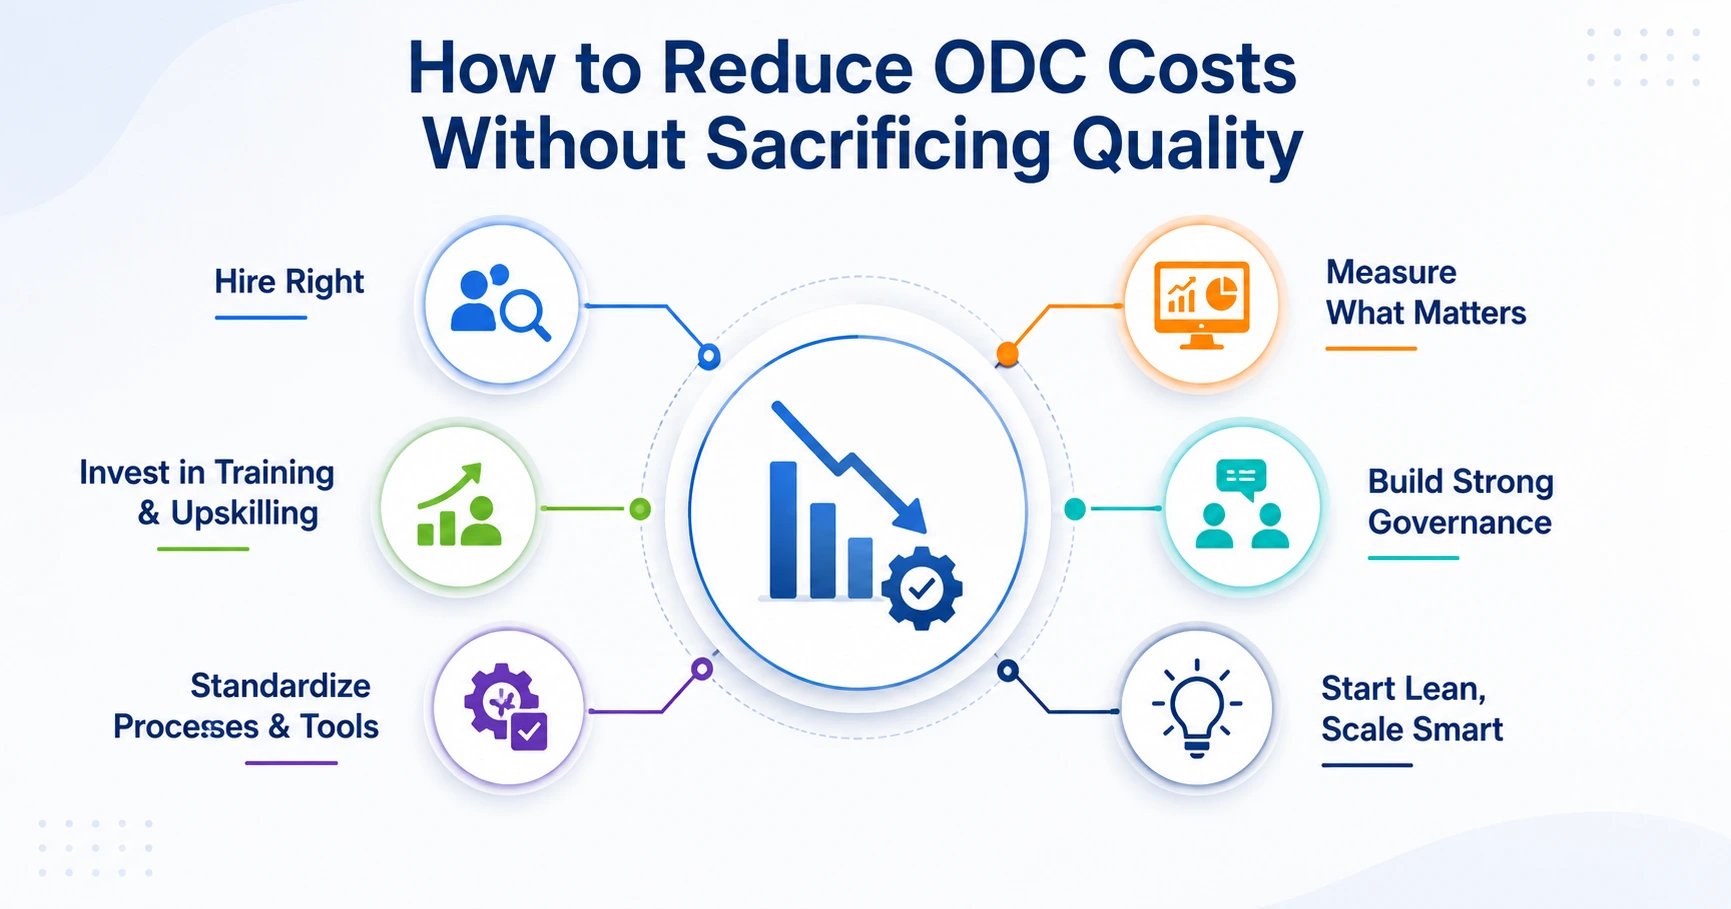
Selecting the Right Location
Location selection saves you 15% to 45% without compromising the quality of your engineers. In India, Bangalore provides you with the best talent and infrastructure. However, starting with Tier-1 cities like Chennai or Bangalore and expanding to Tier-2 cities reduces the risk.
Optimising Team Structure
Avoid hiring only juniors or senior engineers. Build a team with 30% senior engineers for architecture and leadership. Then hire 50% mid-level engineers and 20% junior engineers who deliver quality outputs at an affordable budget.
Leveraging AI and Automation
AI is changing offshore engineering by reducing the team size and increasing productivity. For example, to build a team of 50 engineers, the total AI investment is $15,000 to $25,000 annually. On top of that, you need $200,000 to $350,000 for a one-time setup. With 3 to 6 months of AI training, you can expect the ROI on AI investment.
Choosing the Right Delivery Model
How you set up your ODC affects how much you have to invest in it for 5 years. If you want a long-term commitment and full ownership, build the captive centre. Use the BOT model if you can’t afford setup costs. Go with the offshore development partnership if you’re planning for only 3 to 5 years.
Why India Remains the Leading Destination for Offshore Engineering Teams?
India remains the leading destination for offshore engineering teams as it offers a large pool of skilled tech professionals with strong English proficiency.
Engineering Talent Availability
There are roughly 1.5 million engineering graduates in India with enough talent to fill specialized roles. Hiring for niche roles in any other country would take months.
Cost Efficiency
There is still a salary gap when compared with US and European developers, even after accounting for all the hidden costs.
English Proficiency
India ranks as the world’s second-largest English-speaking country, according to Gartner. This removes a layer of communication friction that other low-cost markets can’t match.
Mature Technology Ecosystem
Decades of IT services growth gave deep vendor networks and infrastructure in cities like Bangalore and Pune.
GCC and ODC Growth Trends
India is adding GCCs faster than competitors like Vietnam or the Philippines before they catch up. Nearly 300 new GCCs were established in India in the past two years alone, according to research.
Conclusion: The Real Economics of an Indian ODC
CFOs are surprised when they realize the real cost of an India ODC is much higher than the simple salary numbers vendors show them.
Key Takeaways for CFOs
The salary comparison is never the full cost – it’s just the starting point. But once you add office costs, paying for people who leave, and management, the real cost is 50% to 70% higher than the starting number.
Building a Sustainable Offshore Engineering Strategy
A successful ODC isn’t about the lowest price per engineer. It is about building an environment where people stay for 2 to 3 years and documenting everything, so losing one person doesn’t break the project. The ODC should also be able to absorb AI-driven shifts instead of ignoring them. Frameworks like The NineHertz’s Continuum AI (Build, Run, Evolve) are designed to make ODCs durable.
Making Data-Driven ODC Investment Decisions
Every number in this cost model can be found and verified by finance teams using reliable data sources and previous client reviews. CFOs should make ODC investment decisions based on real and verifiable data and not on claims that vendors promise without proof.
FAQs
1. What is the total cost of an Offshore Development Centre in India?
The total cost of an ODC in India ranges from $8,000 to $12,000 per month for a small team of 5 members. The costs can go up to $1.2 million to $2.8 million every year for a team of 25 members. Businesses can save anywhere between 40% and 60% by setting up an ODC in India compared to the same centre in the US or Europe.
2. How much does it cost to build a 50-person ODC in India?
Building a team of 50 engineers requires a one-time setup cost of $200,000 to $500,000 and annual recurring costs of $2.2 million to $3.5 million. If your delivery model is a captive centre, it costs around $13 million to $15 million for 5 years. The costs might be a bit higher if you’re looking for a dedicated team.
3. What factors contribute to ODC’s total cost of ownership?
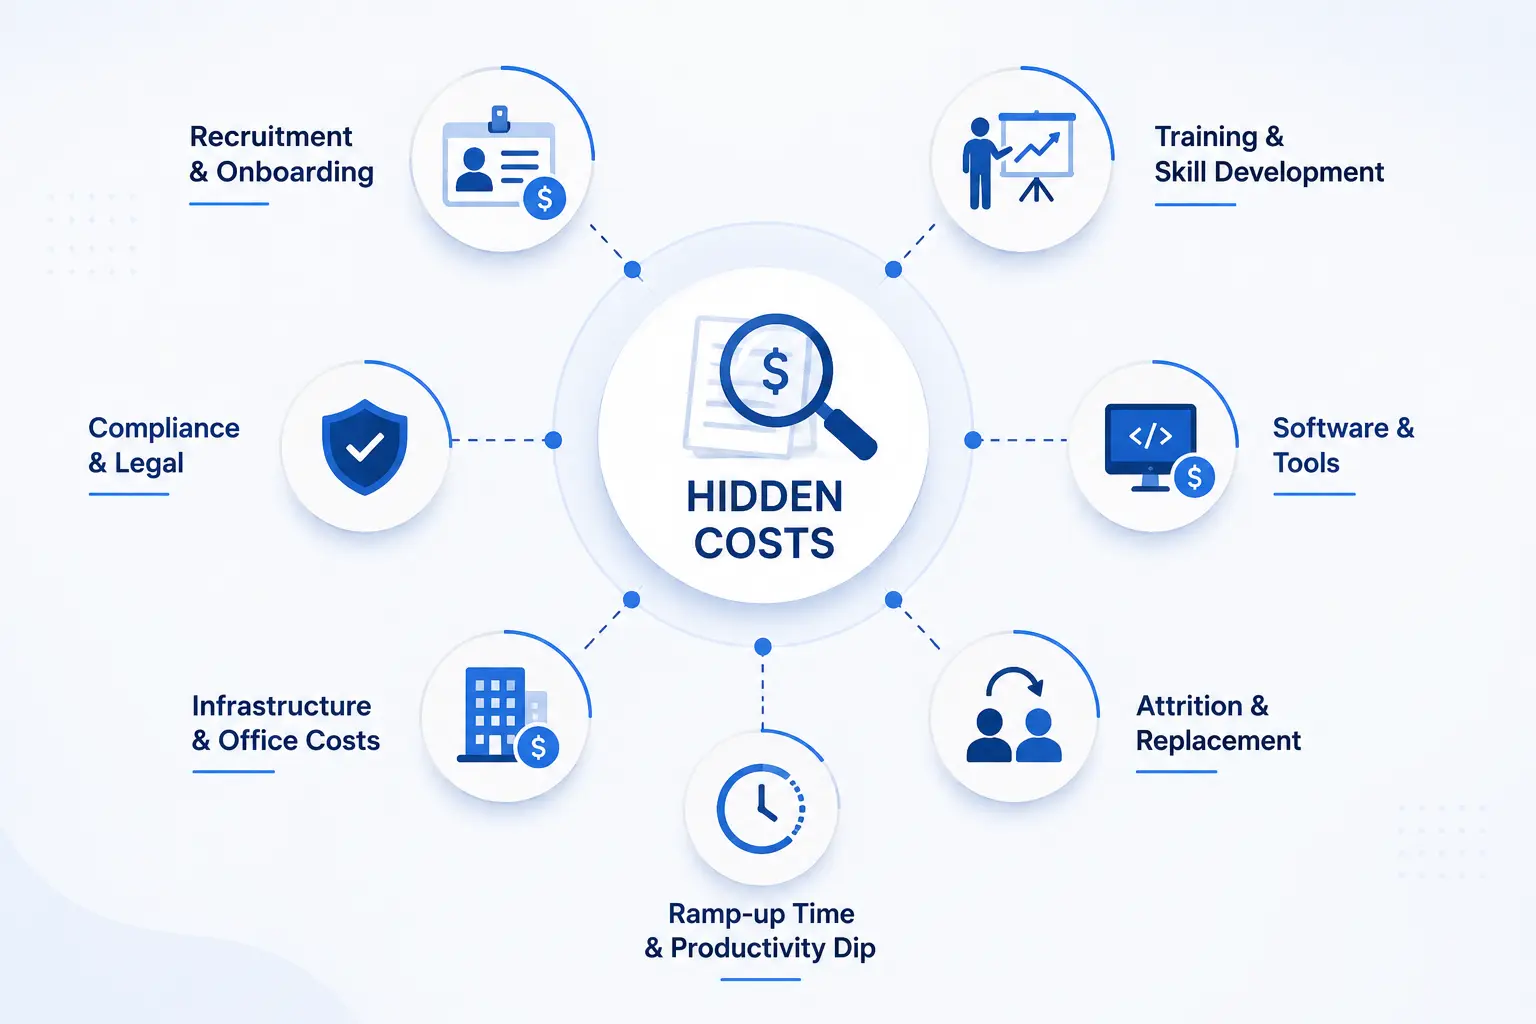
The total cost of ownership for an ODC includes both visible and hidden costs beyond developer salaries.
The direct costs are:
- Salaries and benefits
- Office space and infrastructure
- Technology stack
- Legal fees and compliance
The TCO also includes hidden costs like:
- Attrition
- Management overload
- Replacement hiring
- Training and knowledge transfer